article thumbnail

What’s in Your Fall 2014 Communications Toolkit?

Deirdre Breakenridge

SumAll is a free tool that shows you how conversations progress and you can make comparisons over time. Once you identify a study and topics of interest, you can then take existing research and build your own infographics to showcase the information. so you can see how your actions result in a variety of interactions.

article thumbnail

How Big the Market for PR Software? PR Tech Sum: Burton-Taylor, Cision, Muck Rack, Critical Mention, Talkwalker

Sword and the Script

I’ve started dedicating the first post of every month to summarizing news from vendors developing technology focused on public relations. Consulting firm Burton-Taylor published a report that benchmarks market size and market share for a category of technology the company describes as “Media Intelligence and PR Software.” Here we go….

Software 106
Insiders

Sign Up for our Newsletter

This site is protected by reCAPTCHA and the Google Privacy Policy and Terms of Service apply.

article thumbnail

An Eclectic but Intriguing Mix of 32 Statistics that Summarize Public Relations and Marketing in 2019

Sword and the Script

19% of publishers requested articles, 13% requested infographics, 12% requested mixed-media pieces, and 11% requested data visualizations.”. Technology and innovation may be intertwined, but marketer leaders say their responsibility for both have grown. 77% say they have “more” or “much more” responsibility for technology.

article thumbnail

Public Relations and the Rebirth of Storytelling

Waxing UnLyrical

They don’t sell technology or theme park rides. My local Six Flags may be cheaper, even offer coupon deals but there is really no comparison to the Disneyworld experience. Infographics: AKA chart porn , sometimes the easiest and sharpest way to share a lot of info. It’s the product or service.

article thumbnail

Financial Services Content Report: Industry Benchmarks & 5 Keys to Success

Contently - Strategy

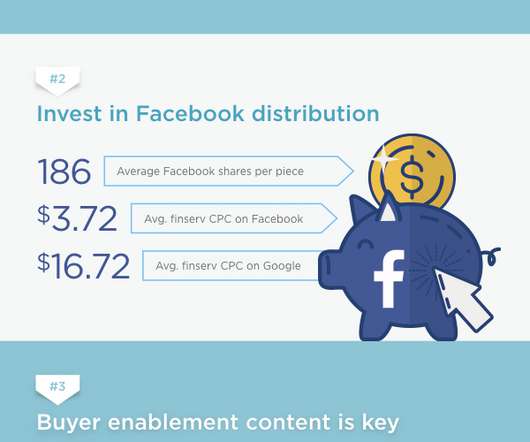
This number includes content creation, distribution, technology, and talent. On one hand, the average finish rate in our data set is impressive in comparison to Chartbeat’s scroll depth benchmarks for all content. Create social videos and infographics. Create social-friendly videos and infographics.

Financial 111