Remove Comparison Remove Infographics Remove International Remove Measurement
article thumbnail

What’s in Your Fall 2014 Communications Toolkit?

Deirdre Breakenridge

SumAll is a free tool that shows you how conversations progress and you can make comparisons over time. Digital Reach : Digital Reach by Cision is a new way for PR professionals to measure UVPM (Unique Visitors Per Month) or “reach,” which is the number of people who visit a site in a any given month. I discovered.

article thumbnail

Financial Services Content Report: Industry Benchmarks & 5 Keys to Success

Contently - Strategy

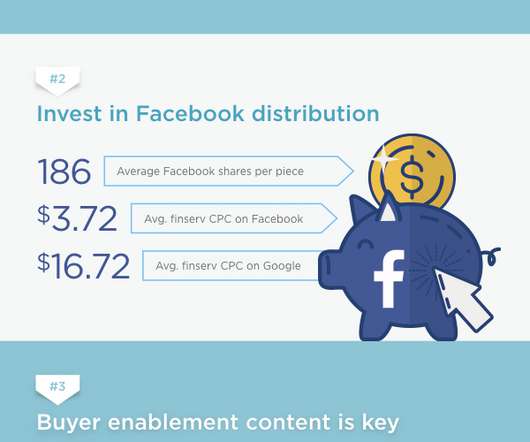
The industry benchmark statistics in the first part of the report came from an internal dataset of 86,270 pieces of content across all industries, measured by Contently’s content marketing platform. Create social videos and infographics. Create social-friendly videos and infographics. Here are our biggest takeaways.

Financial 111
Insiders

Sign Up for our Newsletter

This site is protected by reCAPTCHA and the Google Privacy Policy and Terms of Service apply.

article thumbnail

Digital PR Strategy: Industry Insights and The Methods That Secure Coverage in 2021

Buzzstream

Louise Parker , PR Director at Propellernet , echoes this, “For me, digital PR is measurable PR that is created with SEO goals in mind. However, ‘brand’ usually comes first with clients’ internal PR and marketing teams. Infographics. These are: Improving a client website’s rankings. Interactive Campaigns.

article thumbnail

What is Digital PR? Read Before Starting Your First Campaign

Buzzstream

In contrast, traditional PR has broader metrics to measure public perception and sentiment. For example, a survey piece, a data study, or a story with heavy visual elements like an infographic or map could all be considered hero content. Internal Datasets. So, with so many potential benefits, how is success measured?

article thumbnail

An Eclectic but Intriguing Mix of 32 Statistics that Summarize Public Relations and Marketing in 2019

Sword and the Script

Read more: Would you Run Your Internal Data Through this Media Monitoring AI? 19% of publishers requested articles, 13% requested infographics, 12% requested mixed-media pieces, and 11% requested data visualizations.”. When it comes to metrics, the most common measures communicators say they use involves a mix of old and new measures.

article thumbnail

5 Insider Lessons When You're Creating (and Surviving) a Corporate Sustainability Report

MaccaPR

Key to a corporate sustainability report is knowing what data points should be measured. GNP Company’s Berling also points to the value of consistent measurement. Even when using multi-media or infographics, Berling plans GNP Company’s corporate sustainability report to include long-form narrative. Collect Data. Leverage it!