
The PR industry is facing a financial squeeze right now. According to research by Provoke Media’s Influence 100, there has been a huge drop in PR budgets over the past 12 months – 1 billion dollars to be precise.
And our latest podcast guest Chief Finance Officer Simon Collard, who has over 30 year’s experience, suggested that this isn’t a PR only problem – it’s affecting all marcomms. He adds: “If you can’t demonstrate how your work solves a problem for your client, then your budget could be in trouble.”
So, the way you tell the story of your coverage and results is key.
While reporting tools are brilliant for helping you save time by collating metrics for you, adding commentary, more analysis, graphics, brand imagery and content can help you showcase the true impact of your work beyond the media hits reach. Helping stakeholders to better understand the value PR has to their brand, will put you in a better position when they are deciding where to invest their marketing budget.
The very best reports we see often include custom added slides, pages & images to tell the story of the whole campaign; from objective and insight to activity and results analysis.
You can now do this directly within CoverageBook with our new feature: Slide Builder. Take the faff out of creating separate presentations in PowerPoint and instead use Slide Builder to:
- create and edit slides in an instant
- import your own graphs, or infographics to visualise campaign impact
- write key objectives to compare against performance
- capture the report reader’s attention with engaging brand imagery.
Learn more about using Slide Builder here.
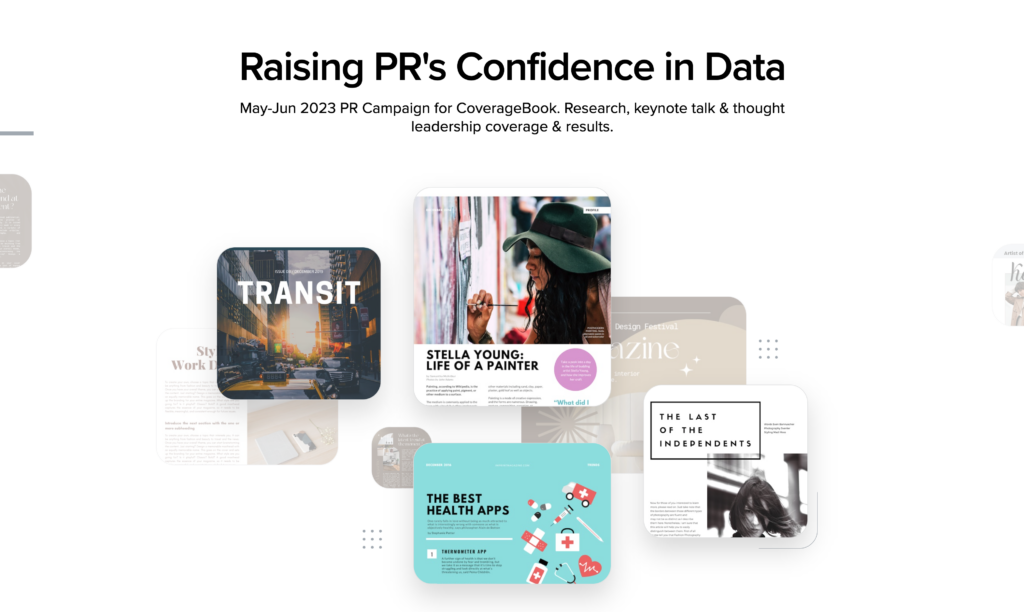
Here are five tips to get you started – I’m using a CoverageBook of our own recent campaign ‘Raising PRs Confidence in Data’ to show you how it’s done.
1.Summarise the campaign
Rather than getting stuck straight into the coverage, include a subtitle underneath the title which sums up in a nutshell the contents of the book. One sentence is all it takes to set out what the report reader can expect to find within. Simple, but so effective.
Learn more about customising the front cover of your report in CoverageBook here.
2.Tell the reader your campaign objective
Using Slide Builder, include a summary of what you set out to do, your overall objectives and how you did it. Again, not too much detail is needed here – think of your busy report readers – encapsulate the campaign in a few sentences.
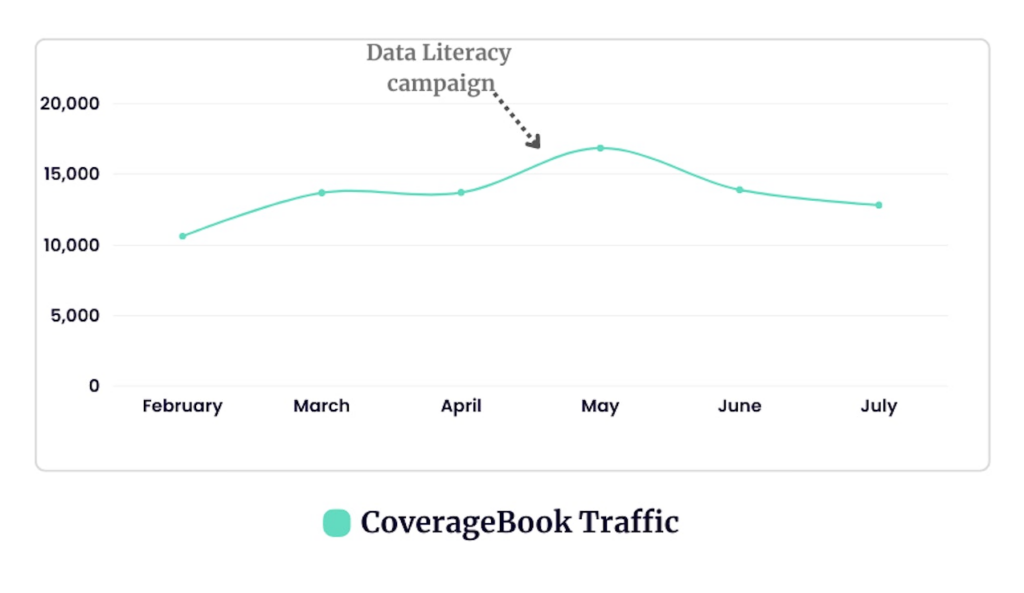
3. Use graphs to highlight impact
We know you’re super proud of every piece of hard-earned coverage, but let’s be honest… stakeholders often don’t have time to look through all of your clips, particularly if you’ve just wrapped up on a massive campaign or an end-of-year report. We hear from senior PR pros that they need to quickly see the numbers and impact when deciding their next move.
A simple graph (which can now be added to CoverageBook with Slide Builder) does this job. Start by making a timeline of when your coverage/campaigns landed, and then overlay it with additional contextual data that may have impacted your campaign, such as:
- Increases in branded search data (You can get this from Google Trends, or an SEO tool)
- Sales/lead data
- Increases in search engine visibility, or traffic to a specific website
- Increases in stock price
- Increases in ratings or reviews
- Increases in donations
- Increases in applicant rates
Read more about adding context to your reporting in Gary’s deep-dive here.
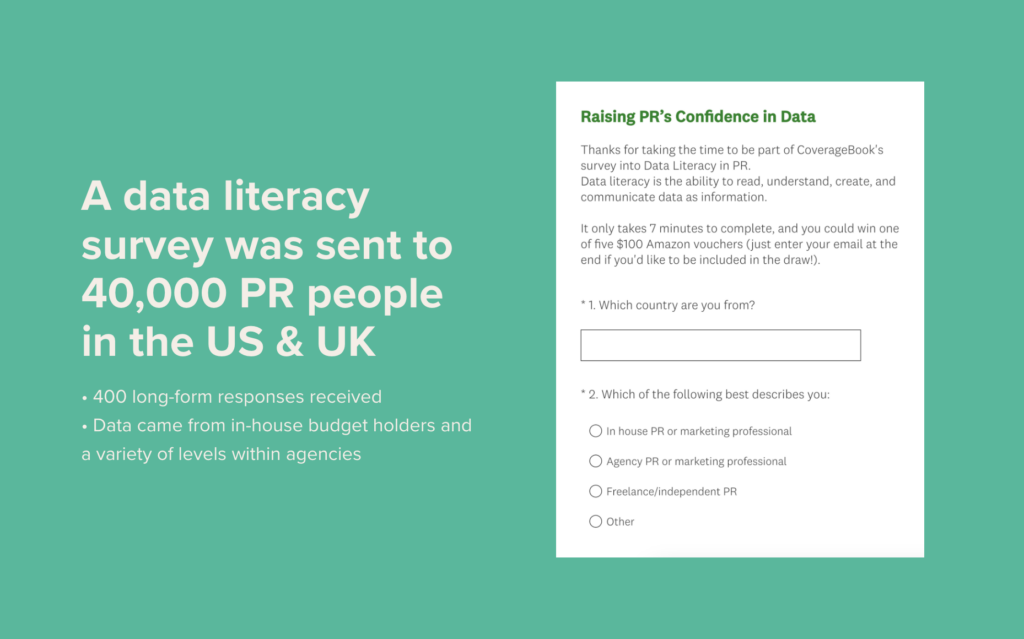
4. Pull out key stats or data points
At the heart of any impactful campaign is data, and reminding the report reader of the insight that formed the campaign will grab their attention. In our coverage book, we used custom slides to include some of the key stats from our survey of 400 PR professionals:

But this example by Dad La Soul is extremely effective with its use of custom slides that lead the narrative. It includes some nice visualisations to illustrate data points, but also simple quotes from people the organisation has helped are hugely effective in telling its story.

5. Use a single hero image
I recently went to AMEC’s Global Summit in Miami where Jonny Bentwood – Global Head of Data & Analytics at Golin – talked about using a single image in your report to sum up the story of your campaign. In our book, we used a photo of Stella releasing our research results live on stage at the conference as our hero image. You can add images with Slide Builder.

You can find more Slide Builder use case examples here.
Now is the time to consider investing a little more love into your end of campaign reports. This can be done easily in CoveragBook. An extra 15 minutes is all it took to allow our own ‘Raising PRs Confidence in Data’ campaign book to tell its own story, but the result is an easily digestible and impressive report that guides the reader through. Good luck!
Sign up for a free CoverageBook trial here.
P.s. If you’re interested in other ways to protect your budget, read CoverageBook’s Stella Bayles recent post on how you can Save $2k of PR budget every month by using technology to become more efficient within your team.
