Table of Contents
I set out trying to write a post about creating a successful survey campaign from start to finish. After bouncing a few drafts back and forth, I realized that I was putting the most time and effort into the ideation phase.
So, I decided to slash two-thirds of my original post and focus solely on ideation.
Here’s the thing: creating surveys is very expensive, and your success in pitching surveys for links is often heavily influenced by other news events of the day.
With those two hurdles going against you, validating your idea before entering the survey campaign process becomes even more critical.
Like a large firm doing their due diligence on a potential investment, your work starts before gathering survey data or pitching anything for coverage.
I worked at a content marketing agency, Siege Media, for six years, and with every successful and failed campaign, I learned a new lesson. And each time, I came away more prepared and excited for the next piece of content.
Here are the lessons I learned and how you can use them to create a linkable survey campaign.
1. Leverage keyword research
I struggled with where to put this tip within my post because it is the most powerful, but it’s also most SEO-heavy. For some in the digital PR space, this will get deeper into SEO and keyword research than you have before. If so, I challenge you to stick with me.
The best way to increase the linkability of a survey post is to tie in a target keyword. You are creating a post aimed at ranking for a keyword and bolstering it with new, proprietary data that you can pitch for links.
Tying content to search volume does two things:
Diversifies your link acquisition: By leaning on search volume, you diversify the way your post gets links. Therefore, the success of your post isn’t 100% dependent on your pitching for coverage.
Avoids the 24-hour news cycle: These are also evergreen posts. Some only need to be updated once per year (sometimes quarterly, depending on the industry). So, should a competitor publish something similar or a significant news event gets in the way, you’ll at least still have the ability to rank organically or pitch a few weeks down the line and still maintain relevance.
The key here is finding a keyword that you can gather data to support. The data can come from a survey purchased through a tool like Yougov, Survey Monkey, Harris Poll, etc. Or it can come from internal data.
You’re looking for keywords with five qualities:
Relevancy
The keyword needs to be relevant to your brand so that the data and story make sense coming from you. (If you are a dog grooming brand, you shouldn’t be covering politics.)
There’s no accurate metric to gauge this, but if you see multiple competitors covering your target topic, it’s probably a fair topic for you to cover.
Low competition
Using a keyword research tool, like Ahrefs, look for lower competition keywords. More established sites can stray into the medium competition keywords, but you should stick to low competition if you are a new site or have low authority.
For example, when I Google “coffee statistics,” I see that it has a Keyword Difficulty of 65. Most of the top-ranking posts have accrued hundreds of links.

Linkability
Take a look at the top-ranking posts for your target keyword. Do they have backlinks? Look for ones with at least 30+ LRD. Sometimes your industry might be such a niche that it doesn’t have links even though others are writing about the topic. While this can sometimes be a sign that no one has done anything interesting with the subject, most of the time, it means that the subject is not one people want to link to.
Take something like “soda statistics.” It has 90 searches per month, but the top-ranking posts have only accrued a few links.

Longevity
The topic shouldn’t be tied to a specific date for this to work. The most common example of this tactic in play is the “statistics” keyword (as you saw in the examples above.) Statistics typically only need to be updated once per year. You can always tell by looking at the other posts that are ranking.
If they are all date-stamped within the past few months, that is a signal that users want fresh content for that keyword. You should be good if the top-ranking posts are over six to eight months old.
Data Driven
Your post doesn’t need to be data-driven entirely, but the keyword you choose needs to be enhanced by proprietary data. The proprietary data is going to make your post newsworthy.
My go-to example of this strategy done well is Andy Crestodina and the team at Orbit Media. They have been repeating a survey for years to compile their blogging statistics and rank for the keyword.
While not all of their 2,700+ links got earned through actually pitching the content, the fact remains that by providing their own data, they will continue to get referenced in other similar studies. And by using search volume, they get eyeballs on their content without pitching.
Look at another example in marketing statistics from Hubspot, and you’ll see a majority of the statistics listed are from their own reports and surveys. Hubspot is setting it up so that whenever others want to talk about marketing statistics, they will likely end up with a link.
But, it’s not just “statistics” posts that work. You can also go with keywords like:
- YOUR INDUSTRY + trends
- YOUR INDUSTRY + facts
- YOUR INDUSTRY + survey
- YOUR INDUSTRY + data
- YOUR INDUSTRY + study
Another consumer survey from Fashion Revolution, which ranks for “fashion survey,” only gets 50 searches per month but has accrued 201 linking root domains consistently since it was published a few years ago. You can see the trajectory using Ahrefs backlink checker.

Some keywords don’t even need a lot of search volume and will still get links over time. Take something like “trucking statistics.” It has a search volume of ten, but one of the top-ranking posts has over 580 linking root domains.
Other keywords need a creative eye to find a way to insert proprietary data to make it pitchable. I haven’t seen this accomplished as successfully by many. But this post on couples sleeping positions has accrued over 90 links and ranks number one for the keyword.
It’s not only a blog post explaining the positions, but it also has a bit of survey data at the end about couples sleeping position preferences.

Looking at this post’s links, you can see a mix of news coverage and other posts referencing the post organically when talking about sleeping positions.

This survey data has allowed them to rank for a topically relevant keyword by pitching their unique data to journalists.
And this is where I believe there is still untapped potential. The most successful brands will find creative ways to insert their own survey data to make a post linkable.
But without a good set of interesting data, you won’t go far. So, let’s chat about ideating the actual survey you’ll be creating to ensure that you are putting out something fresh, emotional, and optimized for your target audience.
2. Work Backwards From Headlines
Starting at the top, even though you don’t know what type of survey data you’ll get, you should at least form a theory. For surveys, your theory can be in the form of headlines or coverage that you want to receive.
By working backward from the headline, you get a sense of the market for your idea.
To get started, create a simple spreadsheet like the one here:

In the example above, I came up with a fictional survey around coffee to further our coffee example from the previous section. Let’s imagine we are a new coffee subscription service, and we are looking to create something to generate some exciting data to rank for “coffee statistics.”
I’ve noted the main focus idea of the project, the headlines we might receive, and then some sample questions that could get us to that answer.
Our theory might be wrong by the time we get the survey data, but at least we have a starting point.
The purpose isn’t to be exact, but since journalists will rarely cover two surveys within quick succession around the same topic, we need to rule this scenario out.
Unfortunately, there aren’t any great tools to develop these headlines, so I’d recommend Googling the word “survey” and going to “News” to see how other brands get coverage.

The rough equation for a successful headline is that it should inspire a user to click. You’ll notice a lot of the headlines have some things in common. They:
- Include a stat
- State something unexpected
- State something surprising
- State something that taps into emotion
To understand the core concept of a shareable, sticky headline, I’d recommend checking out Made to Stick by Dan and Chip Heath. It’s a must-read for marketers. Specifically, look at their SUCCESs method. Apply their method to headlines (and ideas), and you’ll notice ties into what we saw in the headlines above.
Once you have these theories and headlines, it’s time to check to ensure others haven’t already come to the same conclusions.
3. Ensure Your Idea Hasn’t Been Done
Even if you match your survey to a keyword or use survey data to pitch to get links to a post, you still need to ensure that you can pitch your data.
A simple way to find other survey content around your topic is to search for headlines that most journalists might use.
I like to use this search strain: “Most Americans; + your focus.” Then set the date to the last year and look for surveys and coverage.
In our coffee example, a quick Google search of “Most Americans + coffee” has uncovered surveys from:
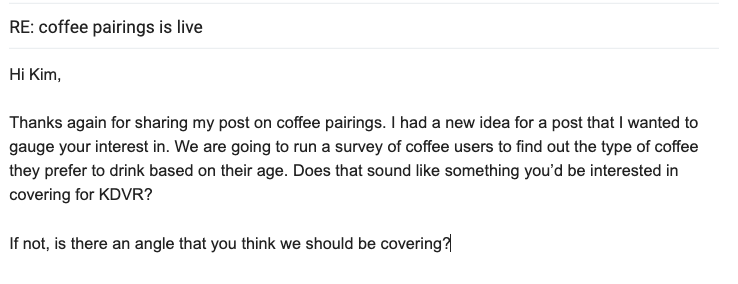
If you find coverage of a pre-existing survey, it’s essential to search for the original study referenced in the article. For example, in the “most americans+ coffee” search, I uncovered this post from a Colorado Fox News affiliate.

Just because the headline isn’t the same as anything on my list, that doesn’t mean the survey itself hasn’t covered my idea. So, digging into this post, I’ve found the original survey produced by a coffee website called Roasty Coffee.
Unfortunately, our idea around coffee brewing methods isn’t a new one:

So, I’d add this to the list under the “competition” column. (It might also give us some inspiration down the road.)

Continue this method until you’re confident that there aren’t any other surveys asking the same questions within the past year.
The second part of this step is to confirm that someone won’t take your idea in the future. Your survey idea might not have gotten covered by competitors in the past year, but there may still be significant reports that come out monthly, quarterly, or yearly. These may overlap with yours.
To check for this, you can search for “monthly TOPIC report,” “quarterly TOPIC report,” or “yearly TOPIC report.”
If we search for “monthly coffee report,” we’ll find several industry reports on the topic.

You can also try terms like “data + your topic.”
When we Google “coffee data,” I see NCAUSA’s National Coffee Data Trends Report.

If I click on their website, the first thing I see is a Fall 2021 report.

Is this something they put out every season? Once per year? I can strategize my content to find a more suitable time to publish when I know this.
Looking at their website, you can see them talking about an upcoming Spring 2022 report:

So, this bi-annual release will be brutal to compete with if your report or survey goes out simultaneously. In the case of NCA, I looked at their newsroom in 2021, where I saw them say precisely when their report went live in this post.

Now you have some timeline parameters. We should steer clear of April and October with our coffee post.
You’ll want to ensure you have a good handle on your industry and the tentpole reports that gobble up the links before getting a foot in the door.
4. Find Your “Pineapple On Pizza”
Just because you have an idea for a post that no one else has done yet doesn’t mean it’s a good idea.
My favorite test for the shareability of a survey idea is what I like to call the “pineapple on pizza” test. When I first saw this Food Fights survey from Porch, I shared it with my colleagues on Slack.
A section midway through asked survey respondents if they put pineapple on their pizza.
This question immediately spurred a heated Slack debate at our agency about whether or not it is acceptable to put pineapple on pizza. (The correct answer is that it is not. Neal Agarwal proved this.)

This pineapple on pizza idea has become my emotion barometer for surveys. If you can get your survey to elicit an emotionally-charged debate, you’re more likely to get eyeballs on your post.
Using emotions to drive engagement is nothing new, but it can be tough to ideate.
There are already a few excellent posts about emotion in viral content, like this one from Fractl, so I’m not going to rehash all of it. But, essentially, some of the most powerful emotions are love, fear, hate, surprise, disgust, etc.
On the brainstorming document, add a column explaining the emotion you are trying to elicit with your content. If your content doesn’t have an evident emotion, try to narrow it down.
Here are some examples of headlines that lean into this:
The more emotion you can tie into your surveys, the easier it will be for a journalist to take it and run with it.
In our coffee example, think back to the Roasty Coffee survey. This survey covers a lot of ground, but their coverage was about adding alcohol to coffee.
“Survey says Americans drink coffee for boost, some add alcohol while working.”
This topic is emotional, a water cooler discussion point.
One tip is to start with an emotion and list everything around your main topic that could elicit specific emotions.
For coffee, here are some example headlines tied to different emotions:
- Surprise: “Americans drink a surprising amount of coffee” or, “X Generation drinks less coffee than you might think”
- Anger: “Most Americans spend more on coffee than giving to charity” or, “Most Americans think ENTER BRAND is too elitist”.
- Fear: “Most Americans don’t realize how much coffee is too much”, or “Are we running out of coffee beans?”
- Disgust: “Many Americans say coffee is to blame for their stomach issues”
The surprise factor is probably one of the most important emotions you can tap. If your data is already something obvious, no journalist will cover it.
For instance, our coffee survey wouldn’t want to focus on how coffee helps you stay awake. That is already evident. Try to find new angles by asking friends or colleagues. Something that might not be obvious to you may be apparent to others.
Test your theories. One way to do this is by pre-pitching your content.
5. Pre-pitch Your Idea to Journalists
Having a journalist’s input before you create a survey post is like a cheat code for your content and a surefire way to elevate your survey’s chances of getting coverage.
Content creators and link builders in the digital PR space shouldn’t look at journalists as a hurdle or separate entity. The pitch process should be a collaborative one. They want a great story just as you want them to share your link.
You can try pre-pitching with something like this:
(Tip: If you aren’t confident the journalist knows you well enough, it can be helpful to respond to a previous thread to remind the journalist of your last interactions.)
BuzzStream makes it as easy to see the journalists you have contacted before and those who have given you coverage.
Some journalists might be active on Twitter and invite you to DM, so keep an eye out for those.
Sometimes the journalist might want exclusive rights to cover your post first, which is fine. Give it to them and then pitch others after it’s live on their site. A confirmed link is better than no link at all.
There are other easy ways to test your ideas if you don’t have access to journalists, are new to the game, and haven’t built up a roster.
6. Test Your Results Before Running a Full Survey
Don’t have any journalists to pre-pitch or get feedback? Some survey platforms enable you to run tests before running an entire set of 1000+ respondents.
You can get a relatively solid idea of how the majority will answer by running a test of 100-150 respondents first. For the most part, those responses are similar to the complete set of responses.
If you don’t have the extra cash to run a sample survey, you’ll need to get creative. Enter Reddit.
Reddit has subreddits for every imaginable niche, and they also have a r/polls subreddit that allows you to poll groups of people. They even list common polls here.

New to Reddit? Check out how Neomam tests all of its content as part of its creative process.
You should be able to find a subreddit that makes sense for your survey idea and ask your questions.
While on Reddit, keep your eyes peeled. If a post has a lot of engagement, chances are it has struck an emotional chord.
Now that you’ve tested, you should feel confident to run the survey. After collecting the data, you’ll need to ensure that your presentation matches your outreach market.
Plan Your Presentation Style
Not all link targets are alike.
Look specifically at the journalist who has covered the survey. If you can match the presentation style, you lower the barrier and make it easier for them to share.
The earlier you can identify these stylistic choices, the better prepared you will be for gathering the data.
Most high-end lifestyle news sites create their graphics, but occasionally they’ll share a map or two. If you aim to get coverage from an industry-specific news site, they may be more open to sharing external data.
Rockmyrun did an extensive fitness survey last year that included lots of in-post data visualizations and an infographic.

But when you look at the coverage, barely anyone shared the infographic or in-post images. Foxnews shared a video compilation of the data. TheSun didn’t include any of Rockmyrun’s visuals.
Let’s look at another example. One of the coffee-related posts that I found was this Zippia post done for National Coffee Day.
Looking at the kinds of coverage they received, it’s mostly radio sites:
- https://975now.com/how-do-michiganders-take-their-coffee/
- https://koel.com/this-is-how-iowans-like-their-coffee-plus-some-coffee-stats/
- https://98kupd.com/the-brady-report-9-17-20-2/
- https://laramielive.com/how-does-wyoming-take-their-coffee/
When you click on the links, you’ll see that a few shared the map and others shared the listicle format.

Others shared “quick tidbits”:

So when I go to pitch my survey to these same target journalists, I’ll increase my chances of getting coverage if I match the medium they received from Zippia.
That means giving them lists, images, or quick facts to make their job of turning around a post that much easier.
Diversify your strategies
My final tip is never to put all of your eggs in one basket. With surveys, you never know what could happen in the news. So, the more you can lean on other ways to ensure your post will rank, the better.
Safeguard your post from some common pitfalls that often sink survey campaigns by spending extra time in the ideation phase. You’ll also come out with a new, emotional, data-driven survey that will make you excited to pitch and pay dividends when those juicy links come flying in.
 Check out the BuzzStream Podcast