

It’s one week after the election, and Joe Biden is the President-elect of the United States. As the results rolled in, professional pollsters took somewhat of a beating in the public eye – they predicted the winner correctly, but not how close the results would be.
Some of this is unfair. FiveThirtyEight acknowledged that the line between a nail-biter and a landslide was a narrow one. The 10 percent chance they gave Trump of winning was an acknowledgment that the polls could be very wrong, but even then, in most scenarios, Biden would win. Which is what happened.
But, it does show that polling as a measure of public opinion is not enough on its own. What people actually do is much more indicative with what people say they’ll do, and even more so than what people say they’re going to do.
What about looking at what people share and say on social media to indicate their preferences? Kevin Roose at the New York Times wrote in August about the possibility of Facebook being the true barometer of public opinion. Using our data and that of others, he noted conservative opinion and news sites were getting as much or more engagement than mainstream media, suggesting Facebook might hint at a conservative “silent majority”.

This quantitative use of social data (at a domain, narrative or page level) can be a hugely important addition to understanding the public, but it can be as much an art as it is a science.
When to use social data
In our experience – and that of our customers – social media and engagement data is fantastic for incremental exploration of open questions, especially when you start not quite sure precisely how to articulate the question. In those situations it’s an enormously useful way of figuring out the views of the public on any issue, person, or topic, how those views are expressed, and how passionately they are felt.
This works for exploration and calibration. For example I recently spoke to Todd Ringler of Edelman, one of the top media relations practitioners in the US, who described using our sharing data to understand the attitudes of audiences in half a dozen major US metros to a particular illness. He could then calibrate precisely a national campaign for each of those markets. That approach took refinement and exploration of social data – and would have been prohibitively expensive to do through polling and focus groups.
This works for mega national trends too. We noticed that almost 200 of the most engaged 1,000 stories about Joe Biden were endorsements from bureaucrats, Republicans, and others. While this isn’t necessarily quantifiable as a data point on its own, it correlates with a public that elected a Democratic president but didn’t turn blue in the way pollsters expected. House Republicans from Bucks County, Pa. to Nebraska’s second congressional district, as well as Susan Collins in the Senate race in Maine all outran Donald Trump, meaning some Republican-leaning voters did not vote for Trump at the top of their ticket while voting GOP in other areas.
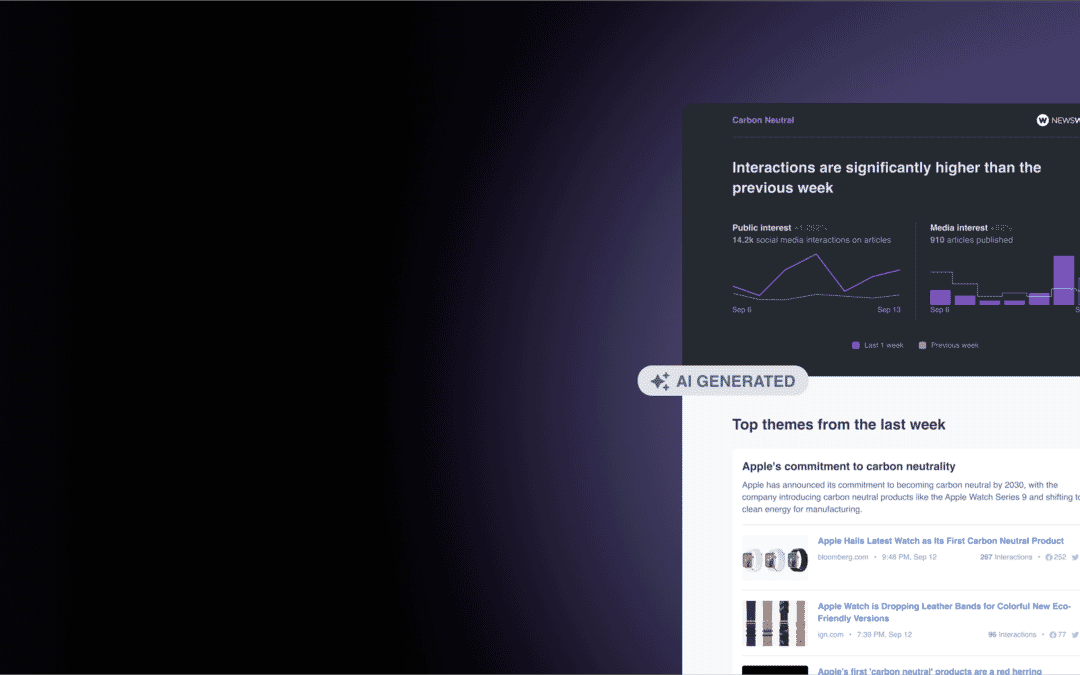
Social data also might have suggested a high intensity of support for Trump among many conservatives, which is utterly absent from mainstream discourse. We regularly publish rankings of the most engaged publishers on Facebook. These revealed a distinct shift towards conservative outlets in August to October 2020, with the Daily Wire ranking highest for each of those months, often by a considerable margin.

Likewise, when we look at the most shared political stories in the two weeks before the election, many were broadly linked with an unsubstantiated narrative of corruption associated with Hunter Biden. This ties with an overarching narrative that Republicans hold about many Democratic career politicians. Articles from The Western Journal and Fox News with claims about Biden’s family were shared intensely.
In assessing the mood and interests of a group, there are few things as telling as what they choose to say and share with their in-group, friends, and followers. And this might be very different to what they anonymously tell a pollster they are going to do.
When polls are valuable
This argument for using social data is not to suggest that polls aren’t valuable. If you already know precisely what questions you want to ask and to whom you wish to ask it, they function perfectly.
There may be a reported intention vs. actual action differential, or sample bias, but these can be – and indeed are – dealt with through statistical weighting by knowledgeable pollsters.
Open question – or closed?
So when to poll, and when to dig into social data?
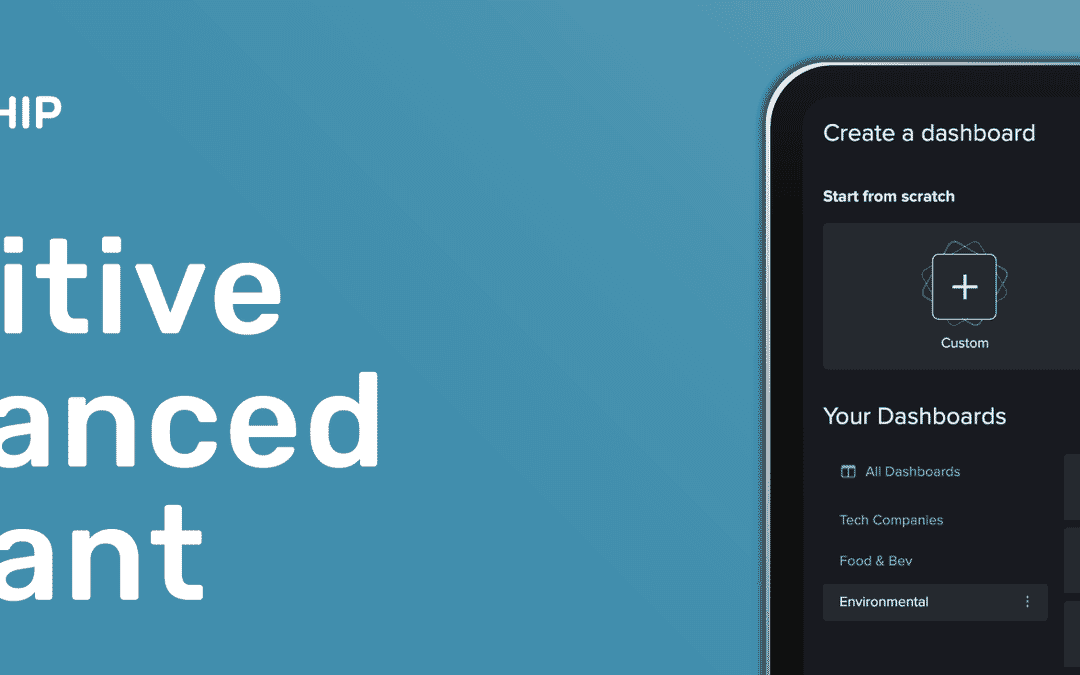
Our social engagement data – which has the expressed view of billions of people – is perfect for open, exploratory questions, that can be answered in incremental ways. Test a hunch about a consumer trend, a campaign idea, or a communications strategy.
Polls are ideal for closed, clearly defined questions e.g. will you buy a Coke product next week? And, of course: who do you intend to vote for? Just remember, people might not always tell you – or even know – what they’re going to do.
If you’d like to add our data to your toolkit, reach out to us here.