How to Create a High-Quality Social Media Report? [Guide 2024]
Table of contents
So, you’re running a social media campaign, investing time, effort, and resources. But how do you know if it’s really working? How can you make data-driven decisions? That’s where social media reports swoop in to save the day.
Social media reports reveal hidden insights into the performance of your campaigns. They provide invaluable data, allowing you to measure and evaluate your social media efforts precisely.
But why are these reports so vital, you may ask?
Well, imagine clearly understanding which posts, hashtags, or platforms bring you the most engagement and drive tangible results.
Imagine being equipped with the knowledge to optimize your content, refine your targeting, and make informed decisions.
A well-formatted social media report will:
- Determine the ROI of social media campaigns,
- Determine the growth or decline of social channels,
- Identify successes and failures so you know what to improve, tweak or delete,
- Present a general sentiment around a brand,
- Measure brand awareness over time,
- Assess the general social media strategy,
- Identify the content that sparks the highest levels of engagement,
That’s a lot of data to process!
Thankfully, you can automate some parts of reporting and get the data that will describe the performance of your social strategy.
So, let’s figure out what a great social media report should include!
- What should you include in your social media report?
- Social media reporting tools
- How to write a social media report?
- Social media reporting tips
- Social media report in a nutshell
What should you include in your social media report?
To produce an insightful social media report, you need to establish the right reporting framework.
Of course, every report will consist of different analytics data, depending on your social posts, networks, or the business goals of your campaign.
No matter whether you are reporting monthly results or creating a new social strategy, there is a social media report template you can use.
Try the Brand24 tool. Create social media reports!
Here are some key components a comprehensive report should have:
01 Executive Summary
Give a quick overview of the report’s purpose, main findings, and recommendations.
The executive summary is a concise section at the beginning of the social media report, providing a high-level summary of the key points.
It serves as an introduction to the report and gives readers a snapshot of its purpose and main takeaways. The executive summary should be written clearly and engaging to capture the readers’ attention.
This section briefly explains the purpose of the report, such as assessing the performance of social media efforts or providing insights for future strategies. Summarize the main findings and highlight the most significant data points or trends discovered during the analysis.
02 Goals
Clearly state the objectives of your social media efforts and assess their effectiveness.
In this part, you need to clearly define and explain the goals you set for your social media activities.
These goals could include increasing brand awareness, driving website traffic, generating leads, boosting engagement, or improving customer satisfaction.
03 Data Analysis
Analyze important numbers and information to understand how your social media is performing.
In this section, you need to look at the data carefully to see how well your social media efforts work.
This means examining important metrics showing how people engage with your content.
You’ll want to pay attention to key social media metrics like engagement, social media reach, sentiment, or click-through rate.
It’s important to present this data clearly and understandably. You can use graphs, charts, or tables to make it easier to see trends and patterns.
Social media analytics is vital. By analyzing the data, you can get insights into what’s working well and what needs improvement in your social media account.
Analyze your social media channels! Create PDF and Excel reports!
04 Presenting Insights
Derive insights from the data analysis. In this section, you need to dig deeper into the data and draw meaningful insights.
It’s about understanding what the numbers and information are saying and discovering valuable information that can help you make better decisions.
By analyzing the data, you may uncover trends or patterns that reveal what’s working well and what’s not in your social media efforts.
For example, you might find that certain types of content generate higher engagement or that specific times of the day result in more reach.
It’s important to highlight these findings and explain why they may occur. This helps you gain a better understanding of what’s driving the performance of your social media campaigns.

05 Platform Analysis
Evaluate social media platforms and understand their relevance for your business.
In this section, you need to assess the performance of each social media platform you are using. This involves examining how well each platform contributes to your overall social media goals and objectives.
Evaluate metrics specific to each platform, such as engagement, follower growth, demographics, the volume of mentions, and social media reach.
Analyze the data to understand which platforms drive the most engagement and effectively reach your target audience.
Identify the strengths and weaknesses of each platform. Determine which platforms are performing exceptionally well and delivering positive results and those that may require improvement.
This analysis will help you decide where to focus your social media marketing efforts.
Read also: How to Measure Social Media Campaigns?
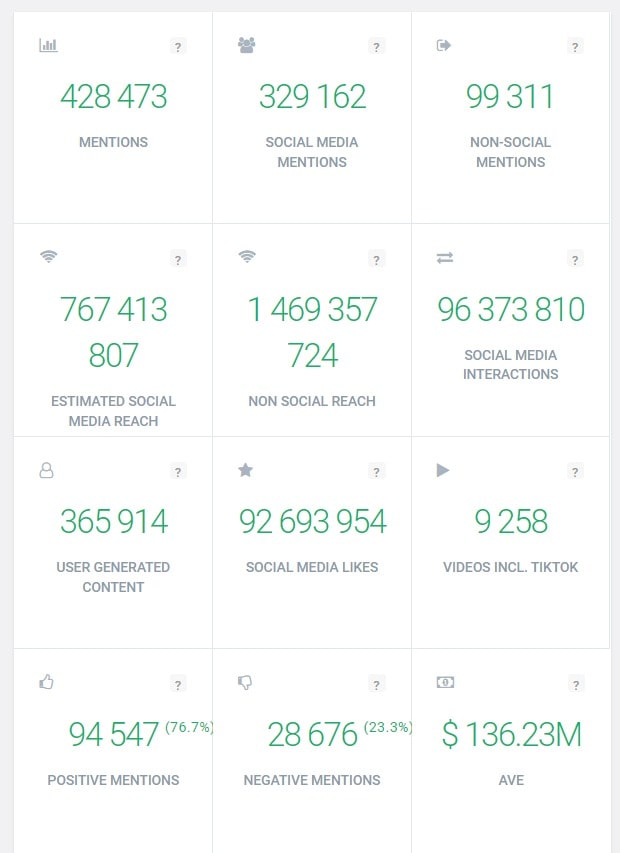
06 Brand Sentiment
Evaluate the overall sentiment surrounding your brand on social media platforms.
Brand Sentiment refers to how people feel about your brand when they discuss it on social media.
To evaluate brand sentiment, keep an eye on comments, mentions, and discussions related to your brand on social media platforms. Pay attention to influential social media users who may significantly impact brand perception.
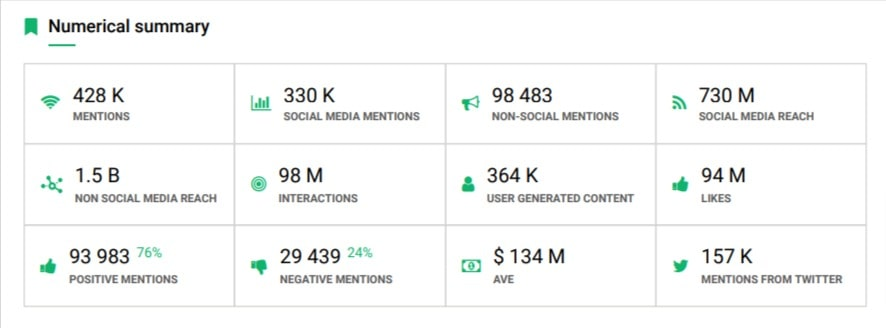
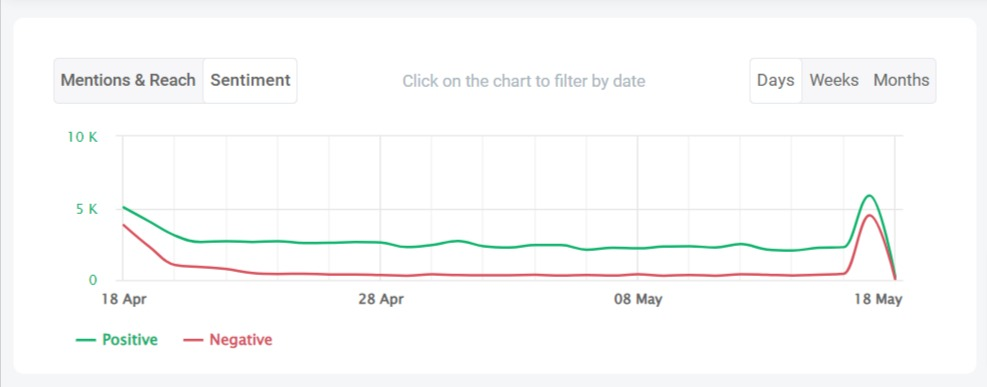
The best way to analyze brand sentiment is to use tools that will do the job for you. Here you can see the social media sentiment analysis of the Netflix brand conducted by the Brand24 tool:
Analyze your social media channels! Create PDF and Excel reports!
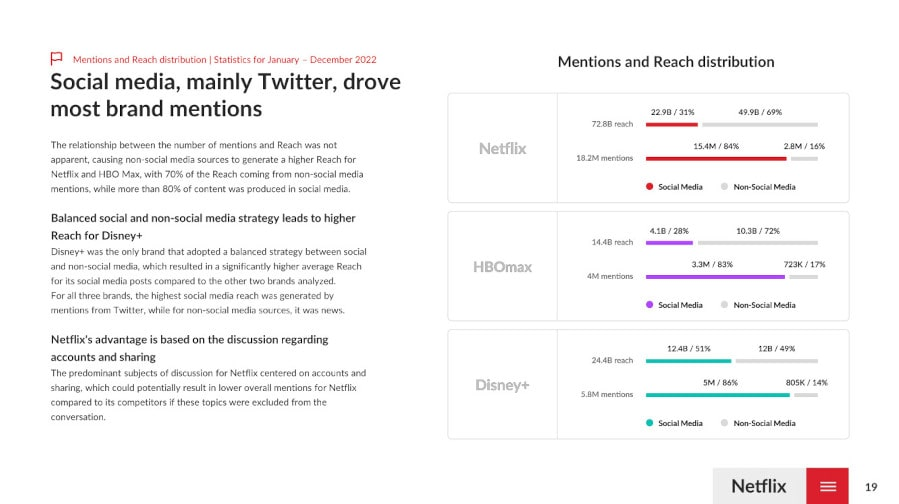
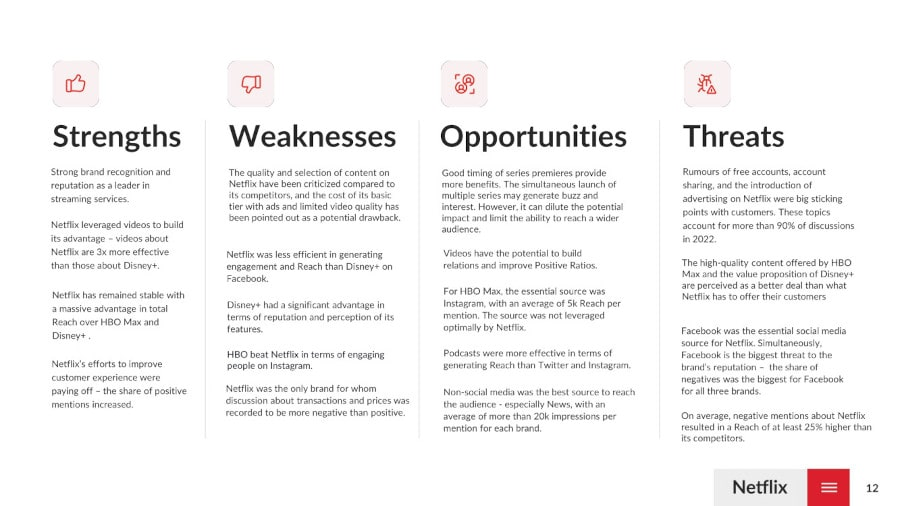
07 Competitive Analysis
Evaluate how your competitors are performing on social media platforms.
The competitive analysis involves studying the social media presence of your competitors to identify opportunities for your brand.
First, identify your main competitors in the industry and examine their social media profiles.
Compare important metrics like follower count, engagement rates, reach, and content performance with your competitors.
Analyze their social media strategies, such as the type of content they share and how they engage with their audience.
08 Recommendations
Provide actionable suggestions for improving your social media performance.
In this section, you need to offer practical recommendations based on the findings and insights from the social media data analysis.
These recommendations should be specific and actionable steps that you can take to enhance your presence and achieve better results.
Consider the areas of improvement identified in the report, such as low engagement or underutilized platforms.
Provide clear guidance on what actions should be taken to address these issues.
For example, you may recommend creating more interactive content to boost engagement or increasing posting frequency to reach a wider audience.
09 Conclusion
Summarize the key findings and emphasize the importance of the social media report.
In this final section, you need to summarize the key conclusions and insights from the social media report.
Provide a concise recap of the most significant data points, trends, and recommendations discussed throughout the report.
End the conclusion by expressing the potential positive impact that implementing the recommended actions can have on your social media performance.
Analyze your social media channels! Create PDF and Excel reports!
Social media reporting tools
Social media reporting tools are software that helps analyze and present data related to social media performance.
They provide key insights and metrics to measure the effectiveness of social media campaigns, track key performance indicators (KPIs), and generate reports for data-driven decision-making.
Key features of social media reporting tools:
- Data Aggregation: Collect data from various social media platforms and consolidate it into a single dashboard.
- Metrics and KPI Tracking: Monitor important metrics such as engagement, reach, impressions, click-through rates, and follower growth. –
- Customizable Reports: Create visually appealing and customizable reports tailored to specific metrics and audience needs.
- Competitive Analysis: Compare your social media performance with competitors to gain insights and benchmark your progress.
- Sentiment Analysis: Evaluate brand sentiment by analyzing user comments and mentions across social media platforms.
- Scheduling and Automation: Schedule automated reports to save time and ensure regular updates on social media performance.
Almost every social media channel provides some sort of free social media report, for example, Instagram Analytics, Facebook Insights, or Google Analytics.
Although the metrics might be enough for a beginner social media manager if you want to show the long-term impact of social media on your business bottom line, a free app won’t suffice.
For more thorough knowledge, you will need a tool that offers more in-depth metrics, for example, the volume of mentions, hashtag’s reach, or sentiment analysis.
Media monitoring tool will track and analyze the metrics you need for your social media report. But that’s not all. The data collected by brand monitoring tools will help you put social data in a broader context. Your company does not operate in a void. To assess the results and see whether you’ve reached your goals, you need to monitor all publicly available mentions.
That’s why using a brand monitoring tool with a strong social analytics component is the best option to monitor your performance.
The data presented here are based on results from Brand24, a brand monitoring tool.
Track your social media performance! Create PDF and Excel reports!
Start with creating a project. In the project creation wizard, add the keywords you would like to monitor, such as the name of your company, the name of a specific product, or a branded hashtag.
Brand24 will start to gather all the mentions with your predefined keywords from all major social media sites, including Facebook, Instagram, Twitter, TikTok, and Twitch.
Because you’re most interested in social media reporting, the vital pieces of information are in the Summary and Analysis tab. Let’s take a deeper look and discover what gems hide inside!
The Summary tab gives you precise information about the changes in various metrics and KPIs, such as:
- Total number of results;
- Social media reach;
- Interactions and engagement rate;
- Sentiment analysis.
You can define the period you’re interested in yourself.
Moreover, Brand24 offers a wide range of filters you can apply to your project. That way, you will analyse exactly the content you need.
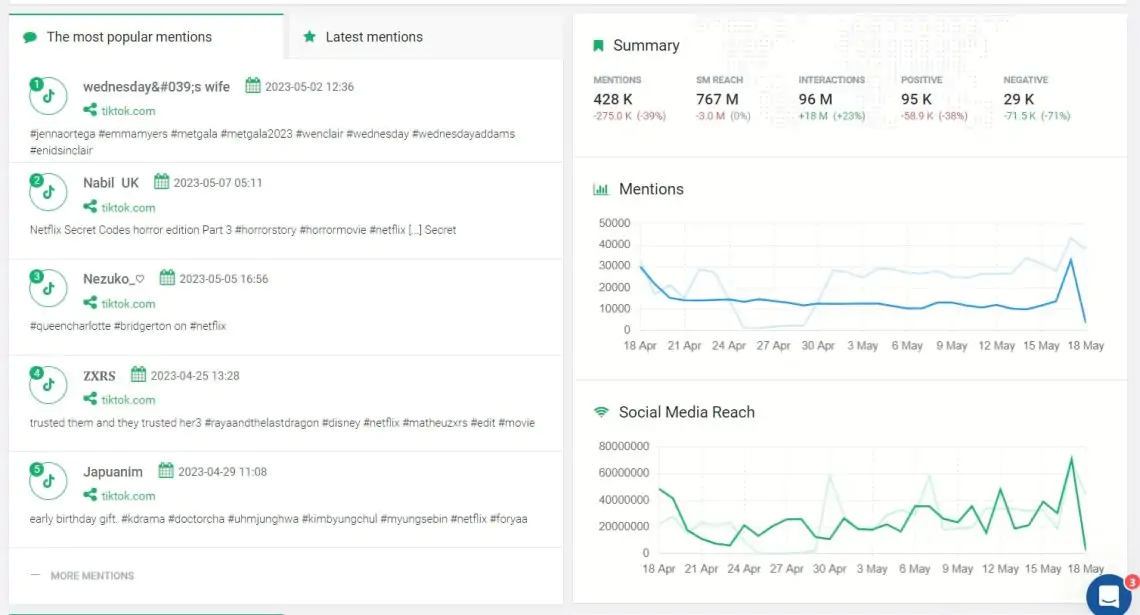
You will find information about the most popular mentions, the most influential profiles, and the most active locations.
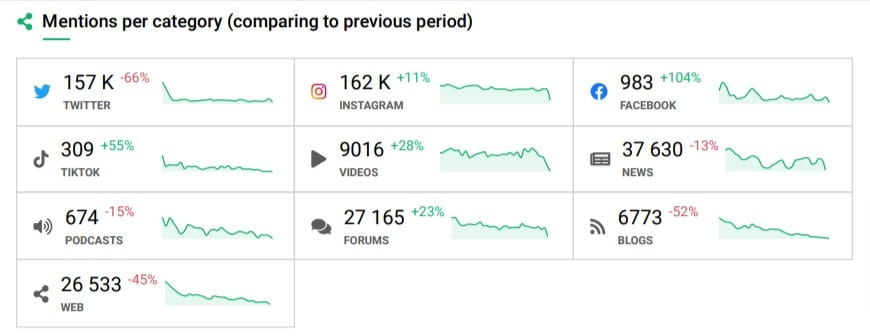
The Analysis tab provides more detailed information about the sources of social media interactions. Thanks to filters, you will be able to assess the number of likes, mentions, comments, and shares from particular social media platforms.
You will also be able to see the most influential social media authors and their share of voice. The share of voice is a number that indicates what part of a conversation was created by a specific author.
All the mentions will be categorized according to the social media platform. That way, you can easily identify the platform where your followers and potential customers are the most active. You’ll find the filter menu in the upper right corner.
At the end comes the cherry on the top of your social media report — a customizable PDF report! You can use to generate a report template that you can distribute across your company and share your insights with a wider audience.
The reports are highly customizable, so you can prepare a separate report for every stakeholder interested in the results.
Every team will get the most important metrics and insights and will be able to start acting on those insights right away.
Track your social media performance! Create PDF and Excel reports!
Check: Helpful Marketing Reporting Tools
How to write a social media report?
Before you start reporting, thing about what your paper for a while. Like with every piece of content, your audience expects to see the value of your work. Whether it’s one of your monthly reports or Facebook, Twitter, or Instagram statement, you should try to contain the most important information.
To do that, try to think about these aspects:
Identify stakeholders
Who is going to read the report? Senior management, marketing and sales department, customer support or everyone in the company? Different teams require different metrics. Some of the teams prefer a more detailed analysis, while senior management would probably like to read something short and to the point.
Ask the right questions
The more specific questions you ask, the better the insights you get. That’s why it’s so important to define your queries right at the beginning of social media report.
I was taught the SMART technique during my Bachelor studies, and I’ve been using it ever since. An example of a SMART question is:
Did our Twitter marketing campaign drive engagement rates by 15%?
Let’s analyse!
- Specific – the question clearly defines the channel (Twitter) and the metric to measure (conversion rate);
- Measurable – with little help from Brand24 you can measure conversion rate;
- Achievable – with a social media strategy in place you can increase your social media engagement rates and boost brand awareness;
- Relevant – the goal will help to increase your customer base, so it’s extremely relevant;
- Time-bound – social media marketing campaigns are usually time-bound. I’ll elaborate on this in the next point.
Research questions
An example of a research question would be:
What do men in their 30s look for in a sports brand?
You probably wonder how to gather information about this topic. The question is pretty broad and requires a lot of work to answer.
There are a lot of answers to the problem, but one of them is social media monitoring.
Once again, set up a project in Brand24, but this time include keywords that focus on sports brands and healthcare. You can monitor phrases such as the names of sports disciplines, athletes brands, or sports venues.
Take a look in Mentions tab. The tool collected all the mentions with your predefined keywords. When you browse the results, you might identify some commonalities among users interactions.
Establish a timeframe
The time frame will depend on the type of report you’re preparing.
A weekly, monthly or quarterly report will cover, well… one week, one month or one quarter, that’s self-explanatory.
Then there’s a social media report that covers the duration of a whole marketing campaign. Remember to include benchmarks from before the campaign started, so you can clearly see the results.
Track social media metrics! Create PDF and Excel reports!
The broadest social media report is the research report. You can freely determine the timeframes here. It’s a good idea to have a broad time range, for example, a whole year. That way no event, for example, Christmas or Black Friday, skews the data.
You may also consider a daily report. It will help you react fast to any emerging social media crisis. An issue can become a crisis in a blink of an eye. Brand24 will collect all the mentions in real-time and deliver them to your smartphone (with our mobile app) mailbox or a dedicated Slack channel.
Social media reporting tips
After you gather all the intel, it’s time to write down a report.
Social media marketing is all about telling a story. The same principle holds for your social media report. You’re still telling a story, you’re just using graphs and charts to make it more compelling.
Specify methodology and background
That sounds incredibly scientifical and boring but it’s a vital part of your social media report.
The background section will determine which metrics your report is trying to measure, why you are focusing on this specific campaign or period, and include campaign details.
The methodology will include the language, timeframe, social media platform or any other relevant detail.
Be direct
A Russian playwriter, Anton Chekhov, famously said:
If in the first act you have hung a pistol on the wall, then in the following one it should be fired. Otherwise, don’t put it there.
In your social media report, the pistol should fire right away. Your boss and coworkers don’t have time to skim through a 70-page report, that’s why it’s important to grab their attention right in the beginning.
Put your key findings right after methodology, so even if your reader reads two pages of your report they immediately get the most valuable insights.
Display the data
I’m a visual person so I enjoy having graphs and charts in my reports. It just makes life so much easier. You should still explain the charts and diagrams.
Context is important. Your boss might see a few negative comments and panic. In reality, the negative mentions might just be a small percentage of the conversation.
Personalize the report
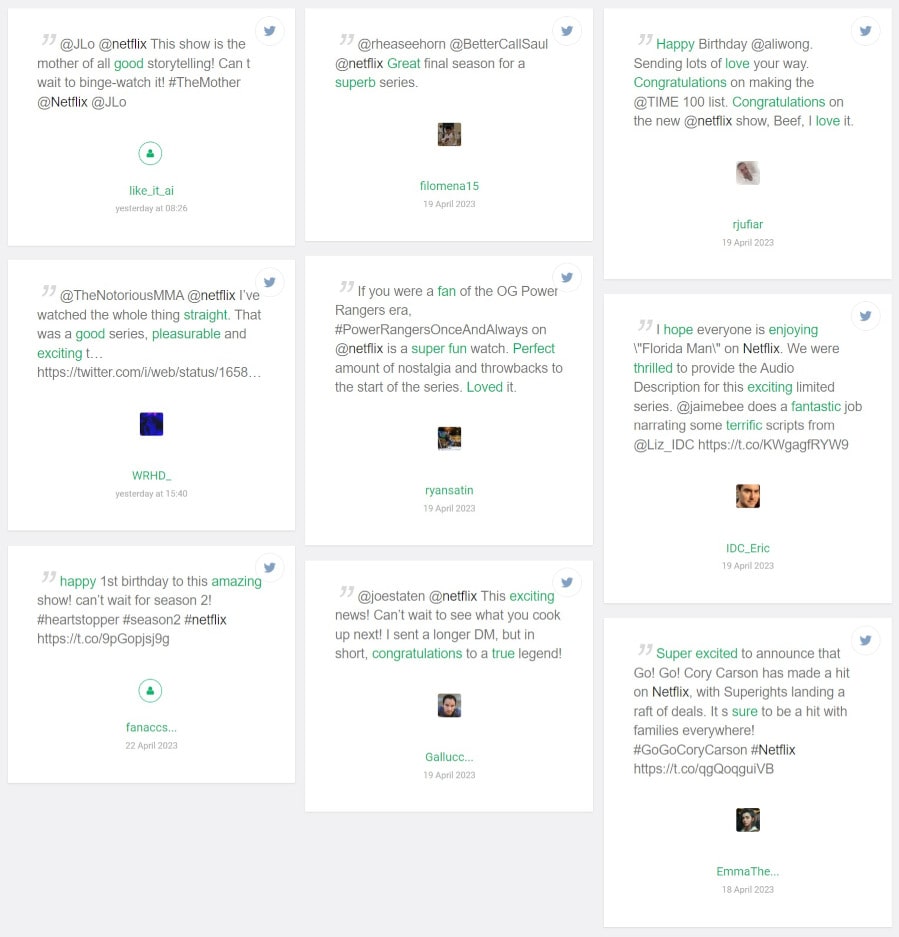
A social media monitoring tool will give access to happy customer quotes and profiles of social media accounts. Take a look at the Quotes tab. You will find quotes from the most influential authors, together with the names of the social media channels they come from and profile pictures.
Social media report in a nutshell
There are probably plenty of websites on the internet that will tell you precisely which metrics to include in your social media analytics and reports. The key, though, for an insightful social media report is personalisation.
Follower count, reach, and engagement rate are not universal metrics and might not provide you with the insights you need. Instead of basing your reporting on a social media report template, it’s better to create a customized solution that contains the key metrics you need.
The truth is, there is no one-size-fits-all solution. Every business deals with a different set of goals and obstacles, that’s why you should start working on your social report by setting up business goals.
Once you know what you want to achieve, look for social media metrics your marketing team should track regularly.
The good news is there are some common social media metrics and frameworks you can incorporate into your social media reporting.
There are different types of social media reports. Choose the reporting method that is useful for your brand at the given moment. It might depend on the type of campaign you are running.
- A regular social media report. It will contain the primary social media KPI, for example, engagement metrics, follower growth or social media reach. It will demonstrate the progress your marketing team is doing while reaching your social media goals. This can be a monthly report that can be created using a social media report template;
- A report after completing a particular social media campaign. It will help determine the success of a product launch, event, or marketing campaign. The impact of marketing campaigns is correlated with a company’s growth;
- A piece of research. You take a more in-depth look at all conversations around a specific brand, product, or event. Research social media report aims to uncover insights about a particular topic.

Related articles
-
 Show article >
Mar 28, 202317 min reads
Show article >
Mar 28, 202317 min readsThe 15 Best AI Social Media Analytics Tools to Use in 2024
-
Show article >
Oct 6, 202315 min reads
The 11 Best AI Social Media Monitoring Tools for 2024
-
Show article >
Apr 18, 202415 min reads
What is AI Social Media Monitoring? Definition [Guide]
-
Show article >
Mar 14, 202212 min reads
How To Do a Social Media Audit [9 Easy Steps]
-
 Show article >
Mar 24, 202312 min reads
Show article >
Mar 24, 202312 min reads11 Steps to Effective Social Media Crisis Management
-
![How to Measure Social Media Success? [2024 Guide]](data:image/svg+xml,%3Csvg%20xmlns='http://www.w3.org/2000/svg'%20viewBox='0%200%20600%20282'%3E%3C/svg%3E) Show article >
Apr 27, 20239 min reads
Show article >
Apr 27, 20239 min readsHow to Measure Social Media Success? [2024 Guide]


![What is AI Social Media Monitoring? Definition [Guide]](https://brand24.com/blog/wp-content/uploads/2022/09/What-is-Social-Media-Monitoring.png)
![How To Do a Social Media Audit [9 Easy Steps]](https://brand24.com/blog/wp-content/uploads/2021/03/5_A-Step-by-Step-Guide-to-Social-Media-Audit.png)

![How to Measure Social Media Success? [2024 Guide]](https://brand24.com/blog/wp-content/uploads/2023/04/How-to-Measure-Social-Media-Success.jpg)