
“Are these numbers good? Or bad? Give me a clue!”
“Why is that number so big? I don’t understand it. Or believe it.”
“Should we be doing more or less of this?”
A little glimpse into the mind of whoever you’ve sent your last coverage report to….
I’ve been thinking a lot about how we measure things in our software business. From feature usage data, marketing data, to app performance data. There is so much of it. Maybe even too much of it. Analysis paralysis is a thing, people.
The tools to spit out numbers are plentiful. CoverageBook is one of them. A tool I’ve helped to make for PR teams to help communicate the performance of their coverage. But just because numbers are easier to come by and present, it doesn’t mean you can slack on the interpretation bit.
Automation buys you some time on the easy stuff. You can use that time in the bank to get better at telling the story of your data. Communication specialists could (and will be) world leaders at this and put some of those annoying data puke “digital” teams with their endless spreadsheets to shame.
So we need to start somewhere. And a good place is to learn about adding context to your numbers.
In my examples, I’m going to focus on mainly output metrics here. i.e. things you can count + measure. Real + proxy metrics can be useful for tracking progress, but they may not help you work out the outcomes of your work.
But there can be no outcomes with at least some output after all! If none of the above makes sense. I get it. It can feel overwhelming. Go and learn more about the AMEC Integrated Evaluation Framework.
But for now…
5 ways to make it easier to understand the numbers in your PR report
1. Reference your goals or targets against your achieved outputs
Instead of just saying “we achieved 12 pieces of coverage this month”, it’s better to say “we achieved 12 pieces of coverage this month, and the target was 5”
i.e. We did well!
Assuming all the coverage was on target media of course and was of some reasonable quality. Go read about Katie Paine’s “Kick Butt Index” for some inspiration on how you could do this.
Setting KPIs is hard. But do try and start somewhere. If you missed the target. Maybe your client/boss didn’t sign off on the better idea. Use this data to help make the point.
2. Show your performance visually
I use a tool called Profitwell to track all kinds of metrics relating to the business. It lets you set targets and see past performance in one graph. I can see how we are doing against a specific target and I can also see how well we’re doing against last month’s performance in one visual.
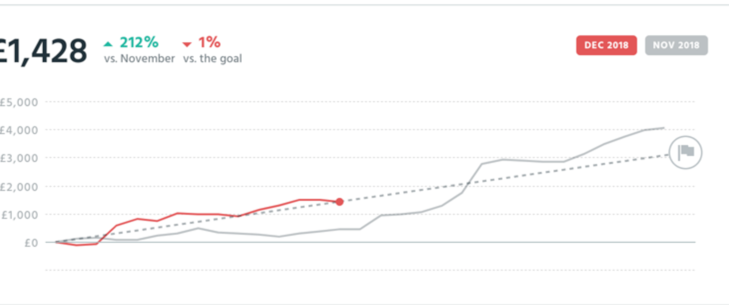
One CoverageBook customer referred to this as running against a ghost lap – it’s like trying to beat your personal best.

It’s better to say or show…
“This month we achieved 12 pieces of coverage, and last month we achieved 20.
or
“We achieved 12 pieces of coverage in December. Here is the trend for the last 4 months.”
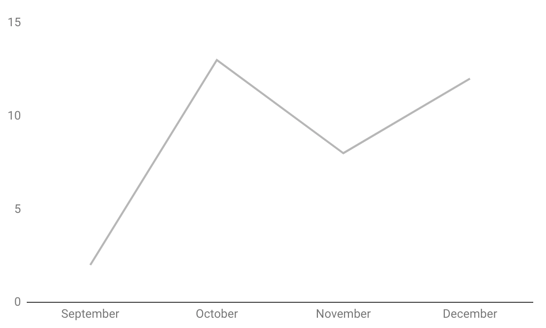
e.g it’s nearly end of month and goal was 5 bits of coverage. we have 1. what are we going to do. Or is it ok as over last 3 months we have exceeded target?
3. Benchmark yourself
Are my numbers any good in comparison to others? Have I achieved similar results for other clients before? What is normal?
Without giving this context into how you are performing in comparison to others, how will the client ever know?
In 2020, we surveyed 1000s of our customers and released some benchmarking data which allowed you to see how your key coverage metrics stack up against others in the PR industry.
Other tool providers and agencies have some fantastic resources that could help you too. Some great resources are:
The 2023 Content Benchmarks Report from Sprout Social
The B2B Marketing UK Agencies Benchmarking Report 2023 from B2B Marketing
The State of Influencer Marketing 2023: Benchmark Report from Influencer Marketing Hub
4. Identify the most important metrics
Some time ago I spotted some wise words on this…
“Gumtree head of communications Fergus Campbell warned there is a risk PR professionals can drown in data and the key is choosing the metrics that matter.
“You need to identify what single data point matters to you and ignore the bullshit noise and abundance of numbers that aren’t helpful to you”
You can do yourself a favour here by exploring with your client/stakeholders what metrics matter to them most. Then consider cutting out the irrelevant ones at least in the report you share with them.
If you’re designing your own reports you can make sure to emphasise the most critical metrics. Make sure your eye is drawn to it. Don’t let the reader drown in dashboard hell.
Again. CoverageBook could do much better here! Working on it.
5. Look for trends over time
Start by making a timeline of when your coverage/campaigns landed, and then overlay it with additional contextual data that may have impacted your campaign.
These could include:
- Increases in branded search data (You can get this from Google Trends, or an SEO tool)
- Sales/lead data
- Increases in search engine visibility of a specific website
- Increases in stock price
- Increases in ratings or reviews
- Increases in donations
- Increases in applicant rates
This one takes a bit more time. But hopefully, it’s triggering some ideas.
If you’re looking for brownie points you could always use the annotation features of other measurement tools. E.g, In Google Analytics you can add text annotations. We use annotations for all kinds of things.
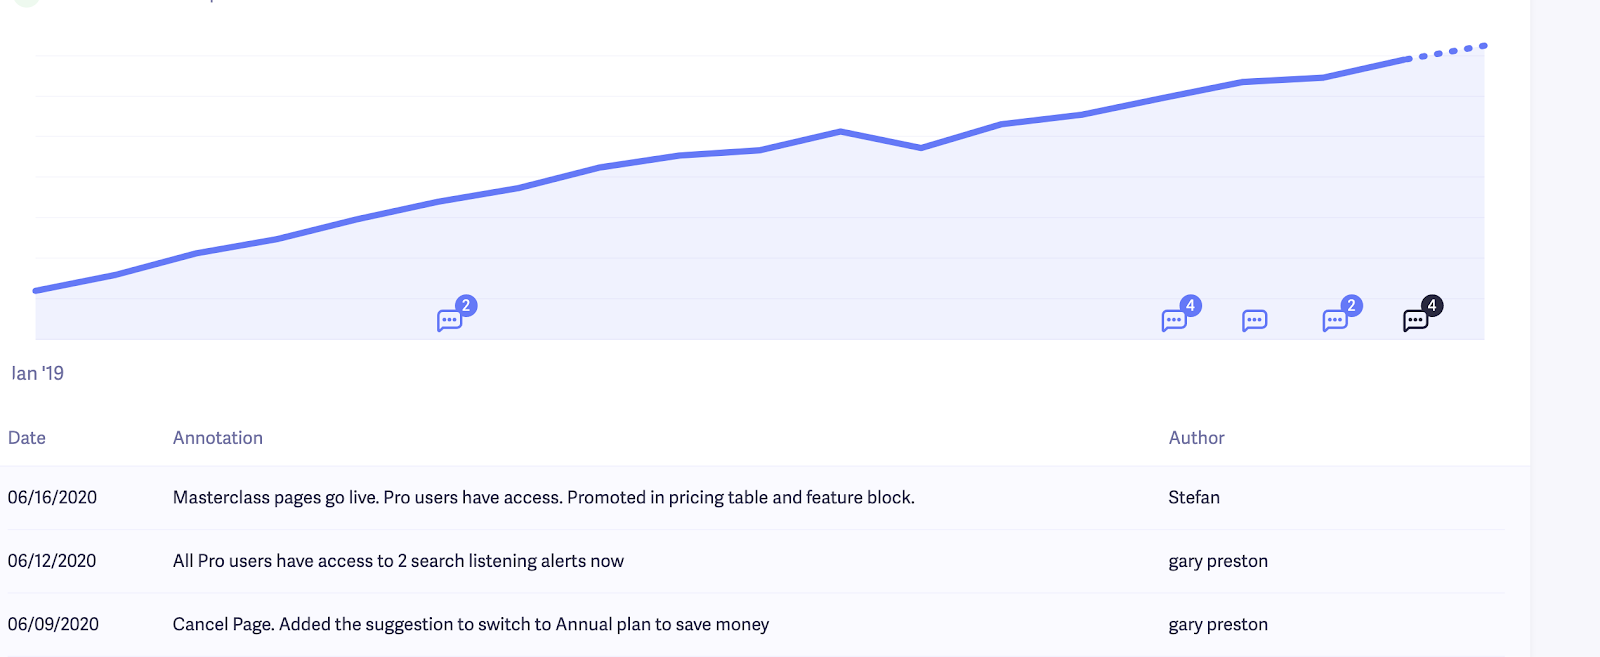
If you’re a CoverageBook user, you can add contextual data to your coverage reports by using our in-app slide builder, or our comment tool which displays your plain text commentary alongside your coverage in reports.
Anyway. I think that’s enough for now. If you’re doing this already. Well done you. If you’re not. Don’t worry about it. Nobody has mastered this. Not by a long shot. Take the simplest idea on this list and try and make a new habit.
I hope at least one of the ideas here makes some sense and could go a small way to making life a little easier for whoever is on the receiving end of your report.
