 I've been doing some work on influencer marketing recently and specifically on why use it, best practices, examples etc.
I'm not going to go in the discussion around whether influencer marketing is the same thing as PR or not, whether it should be PR doing it or the marketing department.
I'll just say that when I was working in a PR agency back 6-7 years ago, I was engaging a group of young beauty bloggers in a very similar fashion as influencer marketing preaches.
Anyway, back to my research. I've published a list of influencer marketing statistics before but I figured it's time to update that and share a new list that's more recent.
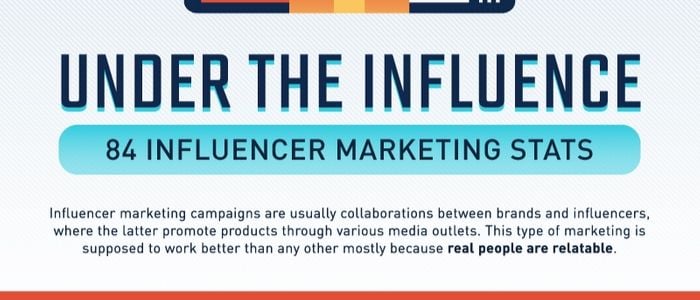
So when I came across an infographic from smallbizgenius I knew I had found what I needed.
It's a long and detailed infographic with more than 80 influencer marketing statistics.
You can check out the infographic below but first, here are the stats that got my attention:
10 Top Influencer Marketing Stats:
- Influencer marketing content delivers 10 times higher ROI than traditional forms of marketing.
- In 2017, for every $1 spent on influencer marketing, brands saw an ROI of $6.78.
- With influencer marketing, 58% of brands have improved brand awareness and 54% have seen an increase in leads and revenue in 2018.
- 71% of brands believe that ambassadorships are the most effective form of marketing.
- Nearly half of brands work with influencers on long-term campaigns.
- For 73% of marketers, choosing in influencer is the biggest challenge.
- 73% of influencers put more effort if they're passionate about the product.
- 52% of influencers say the main reason they work with brands is to build their influence on key topics.
- 65% of influencers also expect some form of reward.
- Micro-influencers with between 2-50K followers deliver 60% higher engagement rates and those campaigns are 6.7 times more efficient than influencers with higher followings.
There are a lot more stats in the infographic covering consumer behaviour as well so I do encourage you to take a look at it.
80+ Influencer Marketing Statistics [Infographic]